For those of you who have attended an Ekahau ECSE course or my CWNA course, you will remember the discussions of “Primary” and “Secondary” RF coverage when using predictive modeling software to design your Wi-Fi infrastructure. The goal of this blog is to quickly and visually explain the difference between the two. “Secondary” coverage is simply a reference to the intensity of coverage you’re providing – a measure of how much signal overlaps, at what RSSI, in a given area. It is not a separate thing from Primary coverage.
When designing for Primary coverage only (where overlap is incidental), the goal is to provide the desired RSSI (e.g. -65dBm) and SNR (e.g. 25dB) to every “square foot” (also, “square meter”) of the facility from one AP. If that AP dies, is disabled, or stops beaconing, then the signal level from the second strongest AP (called “Secondary” coverage) may be weak (or even zero), not providing the level of service that you expect for your client devices.
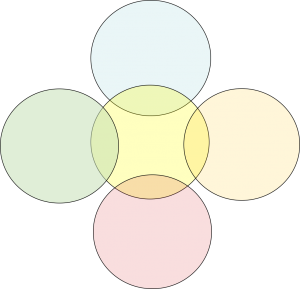
Primary Coverage Example (click on the graphic)
There are only four kinds of channel overlap: None, Some, Less, and More. That “15-20% overlap” guidance you get from manufacturers’ design guides is non-sense. If you’d like to better understand the calculations behind sphere/sphere intersection (as if AP coverage patterns are spheres/circles!), please reference this authority on the subject. If that seems a bit confusing, then try this authority instead. Now, try calculating the overlapping area of two 3D irregular blobs (instead of spheres), and get back with me when you have that figured out. 🙂
Unless there is no overlap, you will always have some level of Secondary coverage. The real question is whether or not that level of coverage meets the needs of the client devices and applications. Let’s now move the APs a little closer to each other to see the effect.
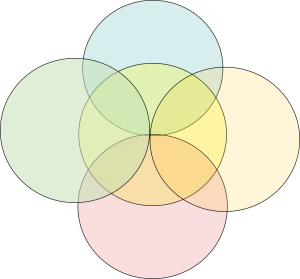
Secondary Coverage Example (click on the graphic)
Notice how, in the picture above, the APs are simply moved closer to each other. The RF doesn’t “stop” at the -65dBm Primary coverage boundary (represented by the black circles around each color), but instead dissipates (diffuses) as it moves away from the antenna. Secondary coverage is measured in dBm (or mW) and is best defined as the area covered by the second strongest AP, at a given RSSI. The APs must be placed more densely for Secondary coverage to increase, and this provides both RF redundancy and could provide better roaming (up to a point). There is a point where excellent coverage can become too much coverage, both wasting money on unnecessary APs and causing poor client device drivers (very common) to exhibit poor roaming characteristics.
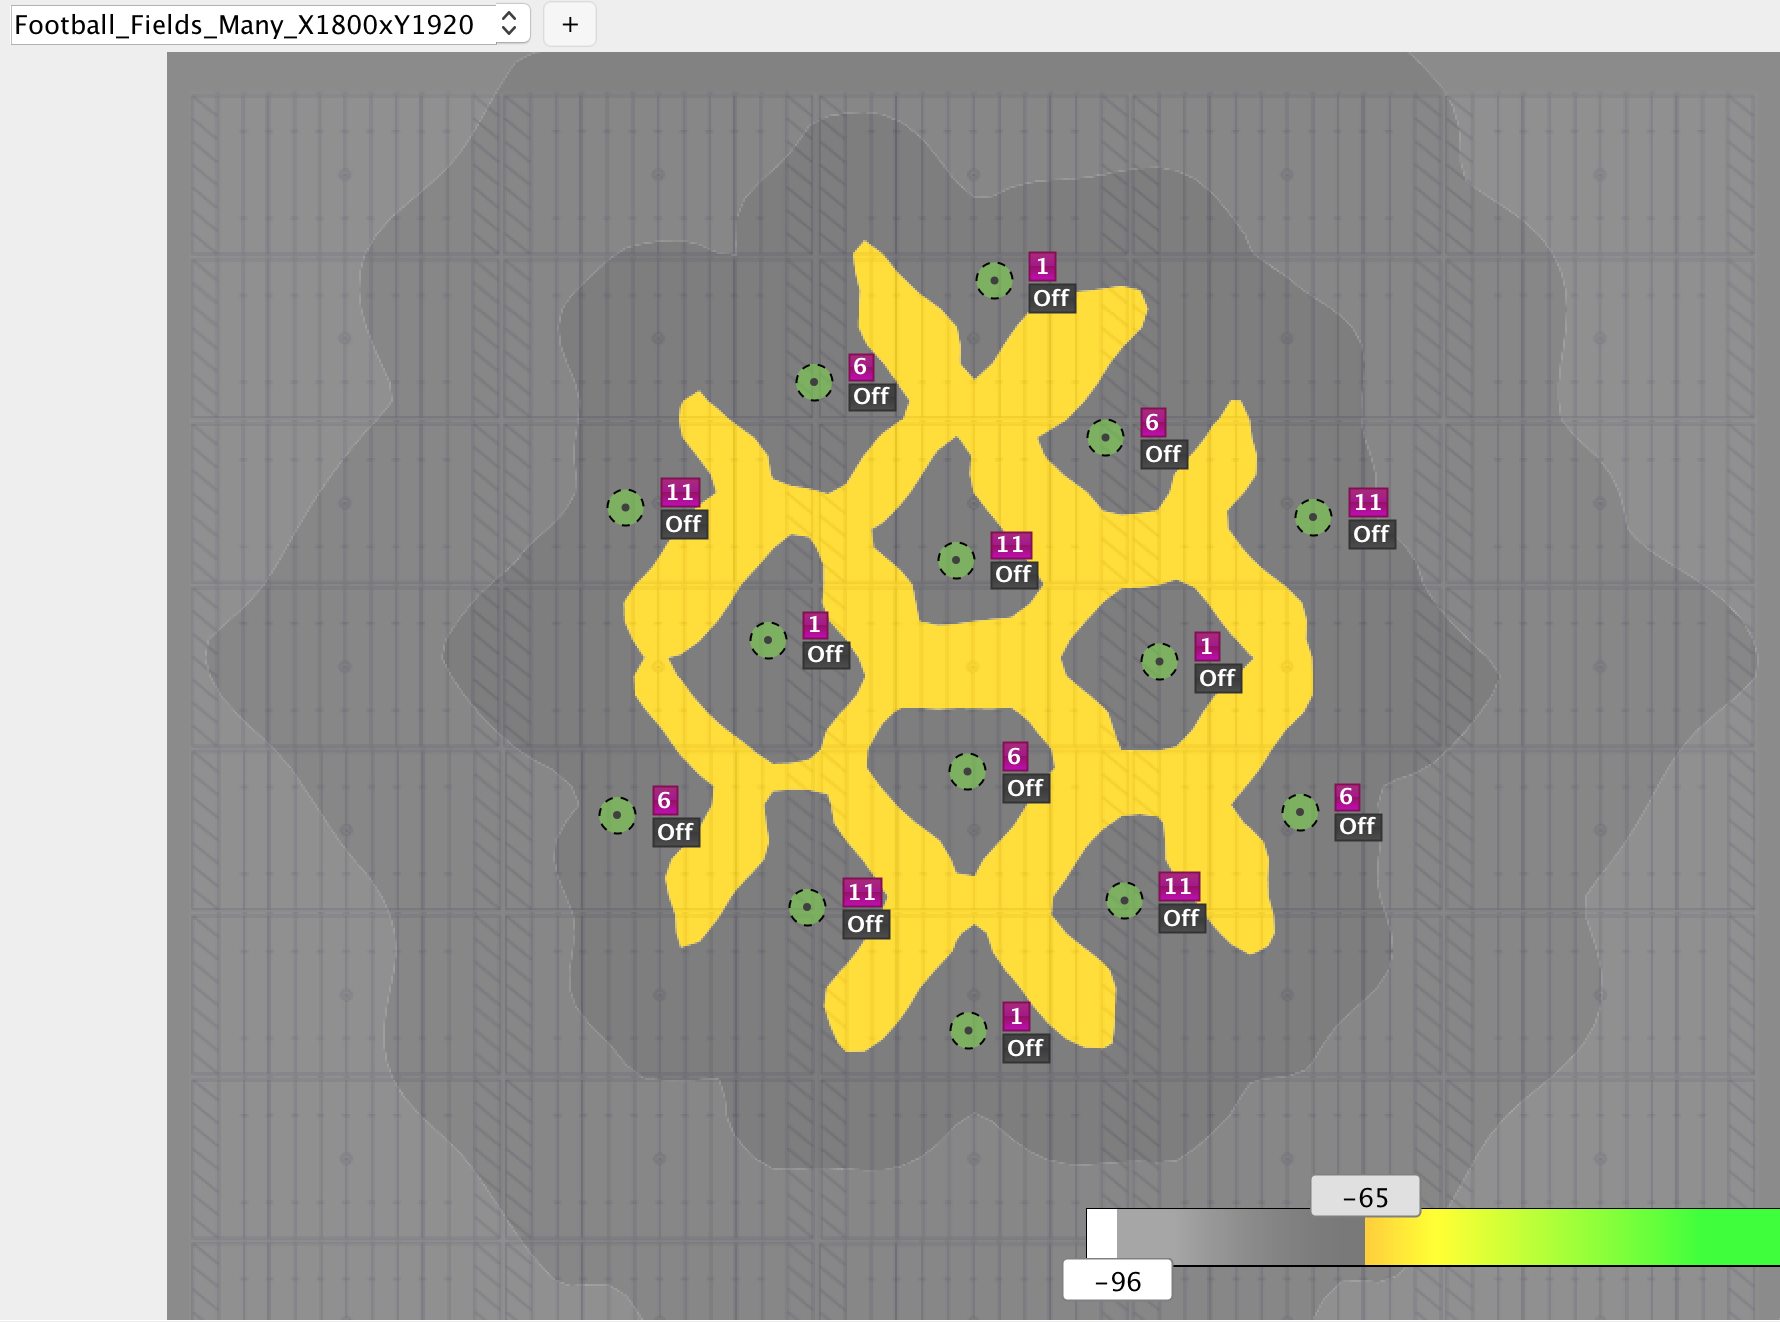
There is often confusion around why you provide Secondary coverage. Secondary coverage, in its most basic form, is about roaming. See the image below to visualize how you can have Secondary coverage only for the purpose of roaming.
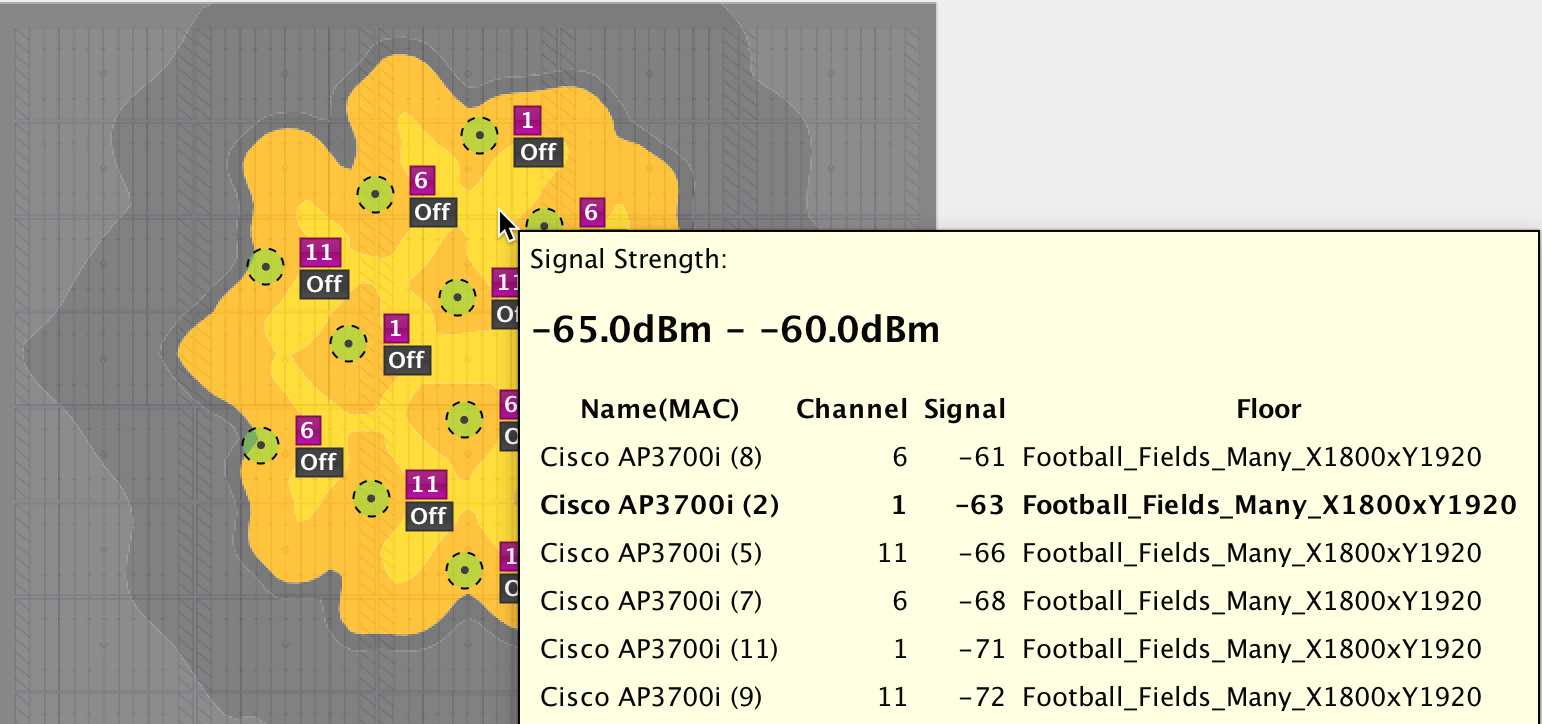
Secondly, Secondary coverage is about RF redundancy (aka “failover). If the AP power is increased, the APs are moved closer, or both, then you can get ubiquitous Secondary coverage (coverage from a “second best” AP on the same band), to a specific power level (measured in dBm). In the image below, I’ve moused over a particular area where the pop-up shows -63dBm for the “second best” AP in bold text. If a client lost connectivity to AP #8 where my mouse is located, then it could expect to have roughly -63dBm of RSSI from AP #2 where my mouse is located.
Modeling Tools (click on the graphic)
Predictive modeling tools, such as Ekahau’s ESS Pro, allow us to see where APs overlap with each other at a given signal strength. Ekahau’s terminology of “2nd Strongest” equates to “Secondary” coverage.
When first learning to design for Secondary coverage in a modeling/planning tool such as Ekahau ESS, AirMagnet Site Survey, or Tamosoft TamoGraph, it’s usually initially confusing when the first AP is placed on the floor plan and the software is configured to view the 2nd strongest signal. The reason for confusion is that no signal is shown on the map. This is because there is no place where two APs have overlapping coverage (at any signal level), which is what you’re asking the modeling tool to show you.
Typical Design Parameters
My typical enterprise deployments use the following settings in the beginning:
5GHz/ -65dBm Primary, -70dBm Secondary
2.4GHz/ -67dBm Primary only
We don’t normally design for Secondary coverage on 2.4GHz because doing so would introduce unnecessary contention (CCI) due to the very limited (3) non-overlapping channel set in the reuse plan. Increasing the Secondary number higher than -70dBm in 5GHz provides additional RF redundancy, but significantly drives up the cost of deployment due to more APs being needed. Consider that -65dBm Primary and Secondary coverage, when compared to only Primary coverage at -65dBm (with only minor incidental Secondary), would be approximately double the number of APs, switch ports, AP and/or feature licenses, support costs, electrical power costs, etc.
Designing for Secondary 5GHz Coverage
The more Secondary 5GHz coverage that is provided, the greater the redundancy in the RF design. If the WiFi network is considered mission critical, and there is budget available to fund the additional APs, Ethernet ports, Ethernet cabling, and support contract costs, then moving the Secondary coverage number from -70dBm to -67dBm can certainly provide an additional layer of network availability and application performance when APs fail. Having worked at multiple manufacturers, I can definitively say that a “normal” AP hardware failure rate is between 0.25% and 1.0% (e.g. 1 in 100-400 APs). This percentage will have some sort of defect-based failure over its useful lifetime, not caused by the environment. Harsh environments can certainly cause that number to rise. Certainly this does not mean that out of EVERY batch of 100 or 400 APs, that you will see these failure rate numbers, but rather on average what the vendor will experience over time, in aggregate. This low percentage is why I normally “play the odds”, going with -70dBm as a Secondary coverage value, and only if Secondary coverage is needed.
Final Thoughts
Secondary coverage is rarely a requirement and rarely needed, but simply a method of providing RF roaming and redundancy. Secondary coverage modeling during the design phase gives us a way to measure channel overlap without using ridiculous math formulas. I hate math.
Great blog Devin, thank you. What is your advice when not only secondary, but tertiary coverage is required in the 2.4 ghz range, say an Ekahau RTLS solution. To me this spells disaster!
Yes, that’s a no-no. Because of 2.4GHz’s three big issues…
1) Limited channel set
2) Strong penetration
3) Dirty/busy spectrum
…I don’t even plan for secondary coverage on 2.4GHz. You will practically always have CCI even with just planning for primary coverage. Past that, it gets ugly, fast. Capacity goes straight down.
Not representing an RTLS vendor (Ekahau’s RTLS was sold to Airista as you may know):
I’m personally also a big fan of “make a sound voice-capable Wi-Fi network design and it should work well for RTLS too”. If you need more RTLS accuracy, use Infrared Beacons / Exciters / whatever.
Thanks Devin for a nice post. What would you suggest if the client base is predominantly 2.4 GHz devices.. not to bother with any secondary coverage?.
Thanks Srikanth.
Yes, that is my suggestion. 🙂
Devin
A vendor’s recommendation is that “at all times an Apple client device observes a minimum of 2 APs with an RSSI measurement of -67 dBm”.
Would that mean that if we were using -67dBm for primary coverage, theoretically the secondary coverage would look like the “Secondary Coverage Example ” image in this blog? Wouldn’t that be almost 50% of overlap?
Since Apple devices normally have a roaming RSSI threshold of around -70dBm, why would we need that much of an overlap in the first place? RF redundancy is one reason.
Hi Theo,
First, that vendor’s recommendation is wrong. The reason that it’s wrong is that they can’t offer a blanket statement like that because primary and secondary coverage is determined by the customer’s requirements, which vary greatly. I have customers using -65dBm primary with no thought of secondary, and it works fine. I have customers who have -65dBm primary and -70dBm secondary, and it also works just fine, but of course they have better RF redundancy in case an AP fails. A blanket statement like, “Apple devices require -67dBm for primary and secondary” is a way to push customers to buy more APs.
There is no “50% overlap”…or 25%…or 15%. Please refer to the “sphere/sphere overlap” URL and check out how complicated such calculations actually are. There are four kinds of overlap: 1) None, 2) Some, 3) More, & 4) Less.
If you only care about coverage, and no RF redundancy, then design for primary coverage only. It will save you money. If you you want additional overlap for better roaming and RF redundancy, then set a goal for secondary coverage.
Hope this helps,
Devin
Great information Devin. Always learning from you.