Most any technical professional within the Wi-Fi market can tell you what an RF Site Survey is. Far fewer, but still a reasonable number of professionals, can perform an RF Site Survey using industry standard surveying software such as:
Each of these software packages is excellent, each having unique strengths. I can easily recommend any of them.
Full Disclosure: Divergent Dynamics is a reseller for Tamosoft and Fluke.
While each of these software packages has some integration with a spectrum analysis software package, none of them could be considered spectrum analysis software on their own. Further, there are no standalone spectrum analysis survey packages. Instead, there are only two flavors of software to choose from:
- RF Site Survey (with minimal spectrum analysis integration)
- Spectrum Analysis (with no survey features)
What is often needed is an RF Site Survey software package that focuses solely on the RF spectrum. Therefore, when I have the need to perform such a Spectrum-only survey, I have to “wing it”. This blog is about how I wing it.
As with all things survey related, I started with a facility floor plan. Second, I needed a way to record onto the floor plan the captured spectrum data. I decided to use PDF Expert 5 by Readdle, as shown in Figure-1 because it works exceptionally well on an iPad Mini, which I used for note-taking, picture-taking, and recording time stamps onto the floor plan.
Figure-1

Referencing Figure-2 below, you see a simple facility floor plan (supplied by the customer) with a starting point (with time-of-day) and recorded time marks (corresponding to the spectrum recording) on it.
Figure-2
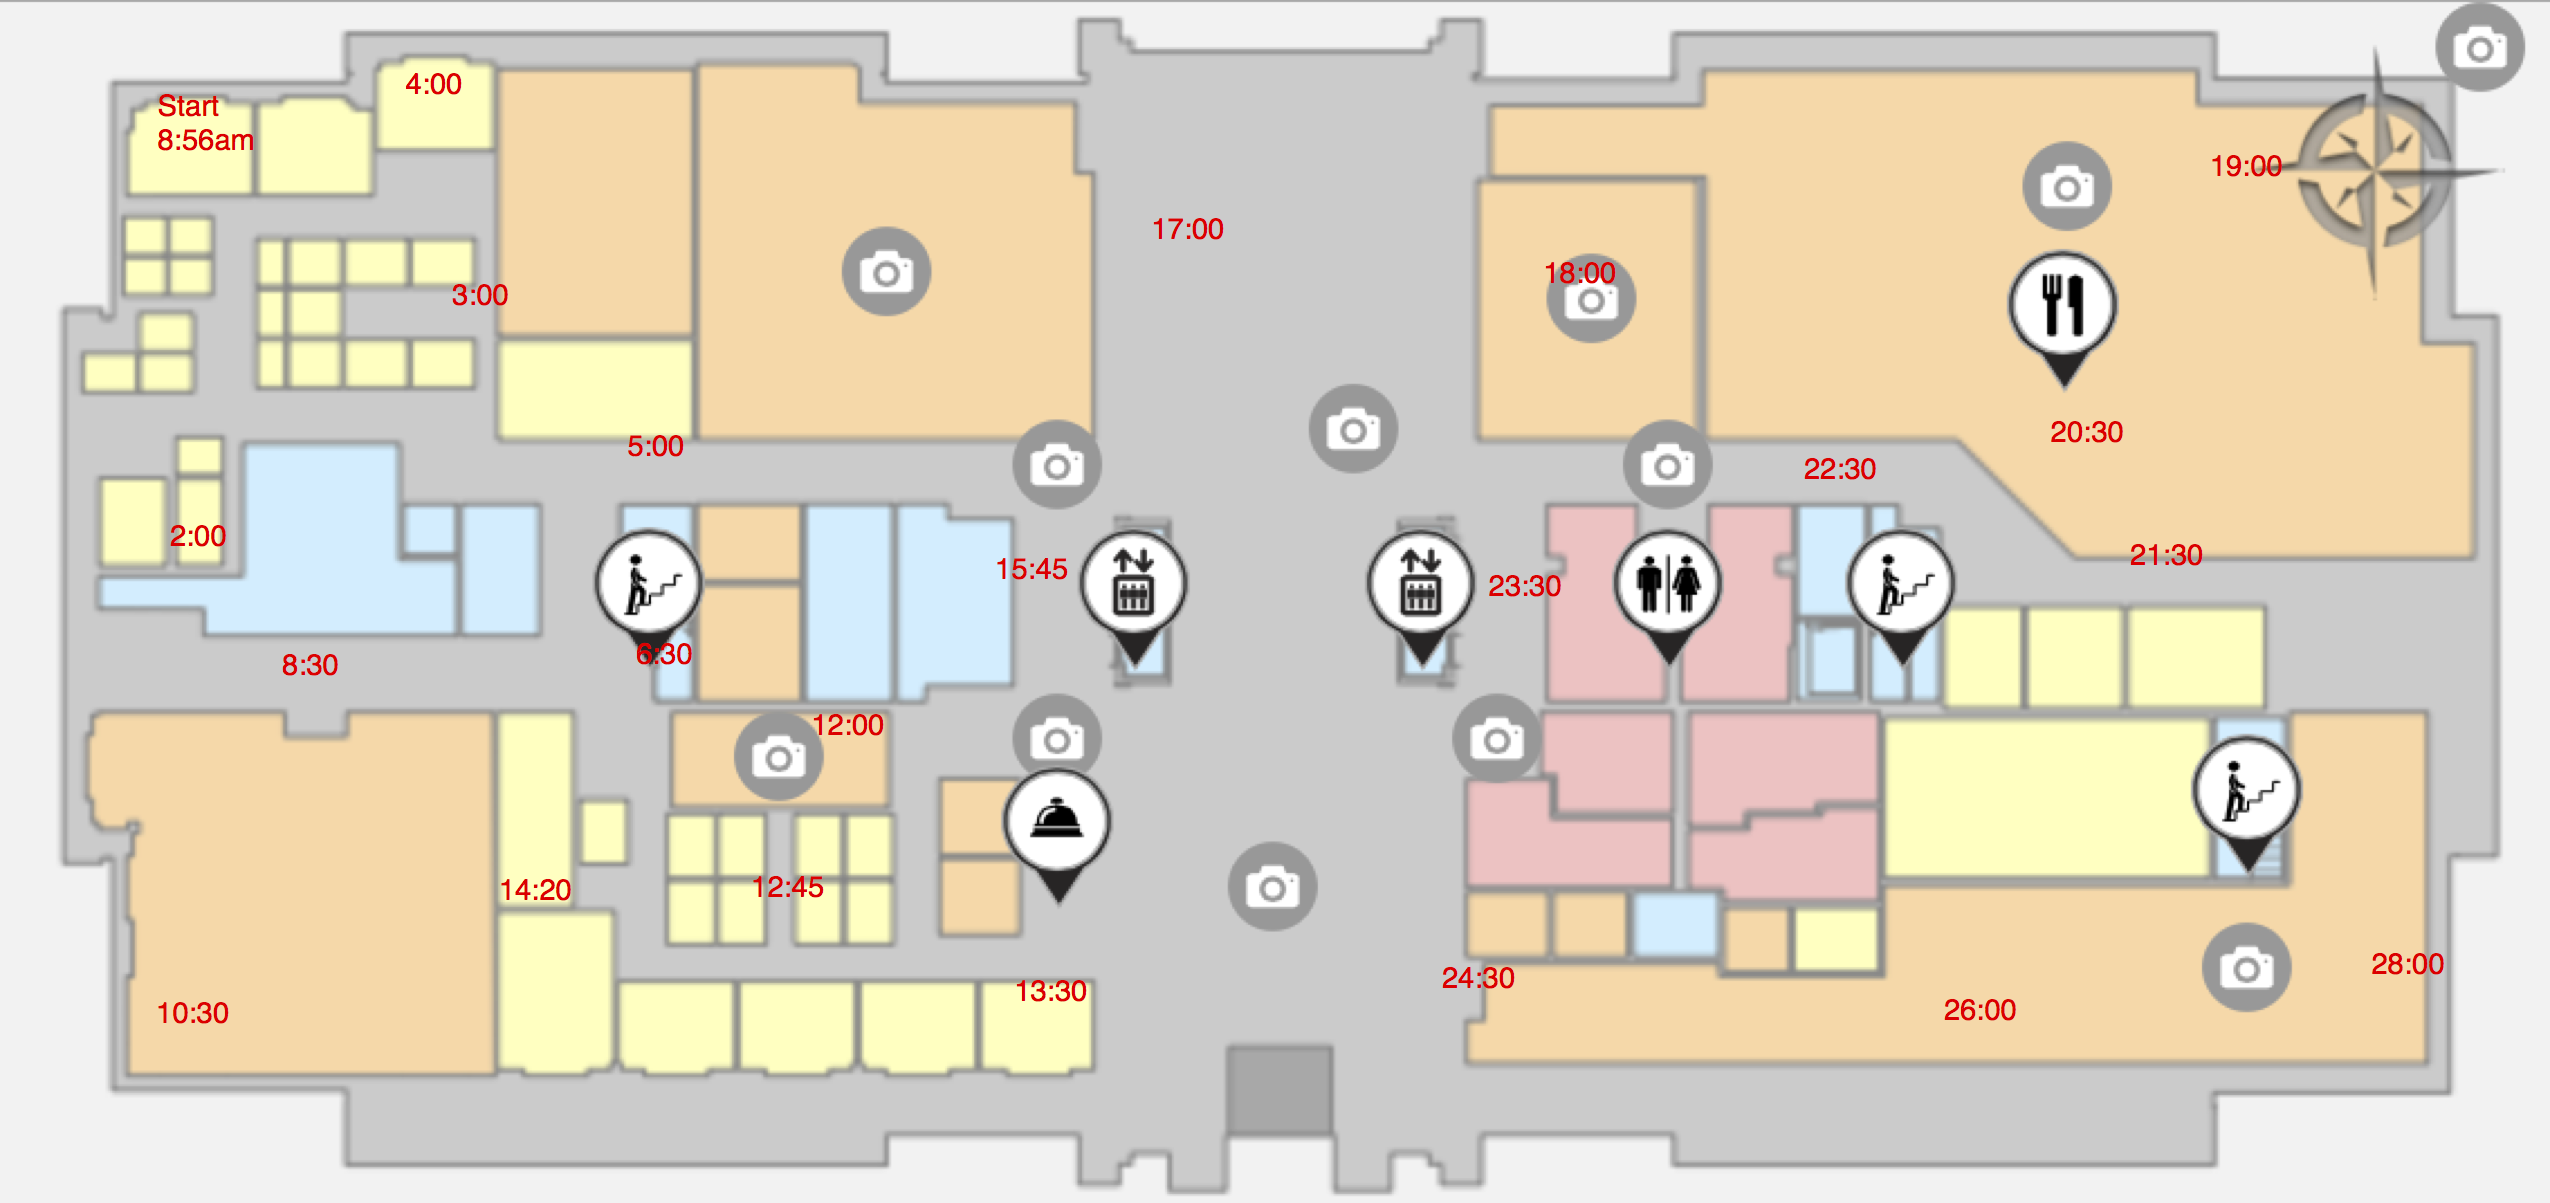
Using an enterprise-grade spectrum analyzer software that supports recording and saving features, the process begins with choosing a starting point on each floor, marking the starting point and time of day (for future reference), and then walking around the facility. RF Site Survey software would normally track the walking path, but in this case:
- that level of granularity isn’t needed
- you can track a rudimentary foot path by looking at the time stamps on the map (in order)
For example, to see what the spectrum looked like at 15:45 (center/left time stamp on Figure-1), you simply go to that point in time during the capture and take a look (reference Figure-3).
Figure-3

If you have a 5-story building, then in order to keep things simple, each floor could be its own spectrum capture. That means 5 floor plans and 5 modest-sized capture files. It’s noteworthy that some of these spectrum capture files can get very large, so breaking them up by floor is a good idea in many cases.
There you have it: a simple way to do a spectrum-only survey, without compromise. Wouldn’t it be great if the industry-leading spectrum analysis software providers would give us site survey capability?
What are your thoughts? Do you know another way to do this? Please share!
Hi Devin,
Tamograph has a nice integration with Metageek. It still requires using Metageek for any lower level analysis but for high level concurrent representation, Tamograph will do fine.
Saying that, I find it coming down to personal preference on performing site surveys. Active, passive or “spectrum” site surveys all have different dynamics and cost (time) associated to it.
Gregor
Devin
AirMagnet survey has spectrum XT integration, it’s been there for a few years, however it uses a lot of battery. I find myself leaving a laptop running spectrum xt at specific data points for small intervals of time. Then I go back and do a review.
I also note lunch and break rooms. If there is a microwave and if time permits I’ll also do a quick study to see where the microwave sits on the spectrum and note it in the report.